Export Network Logs in Google Chrome (Easiest Way in 2025)
In this tutorial, we will show you exactly how to export network logs in Chrome in just a few simple steps. Read on to learn more.

Exporting Network Logs in Chrome
Follow the steps below to export network logs on Chrome.
1. Open Developer Tools in Chrome
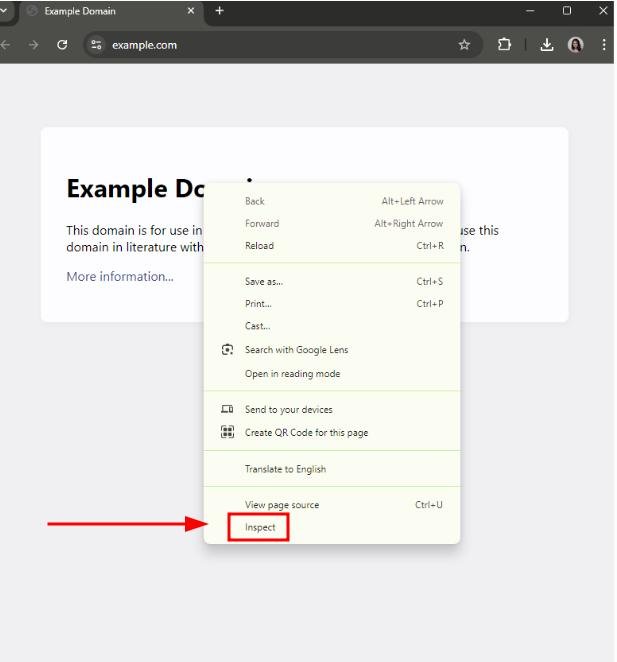
Open Chrome Developer Tools to begin. Press F12 or right-click anywhere on the page and select “Inspect” to access the necessary tools.
2. Select the Network Tab in Developer Tools
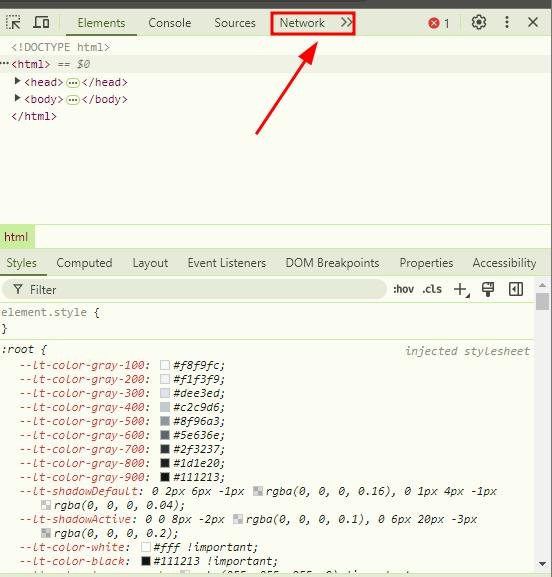
Navigate to the “Network” tab within Developer Tools. This tab allows you to capture all network requests and responses for the page.
3. Enable Network Recording
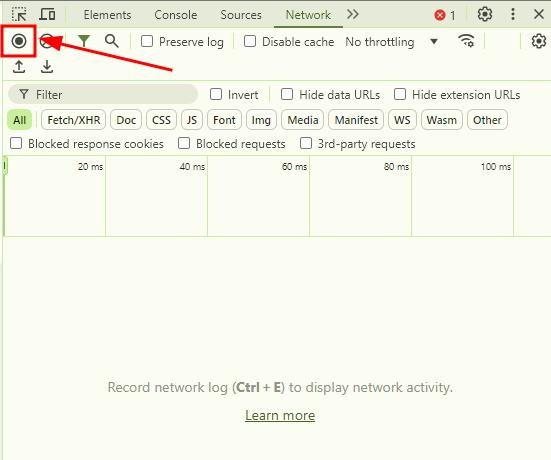
Ensure network recording is active by clicking the round record button. Alternatively, you can press “Ctrl + E” to start recording. This action starts recording all network activity on the page.
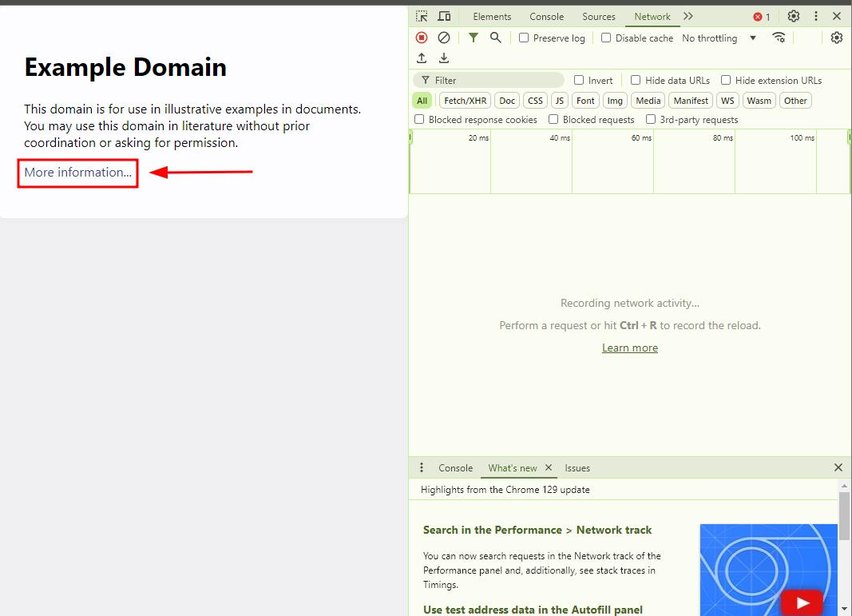
4. Perform Actions on the Page to Capture Logs
Interact with the web page or reload it to capture network activity. In our example, let’s click on “More information.” This step generates the data that will be saved in your network logs.
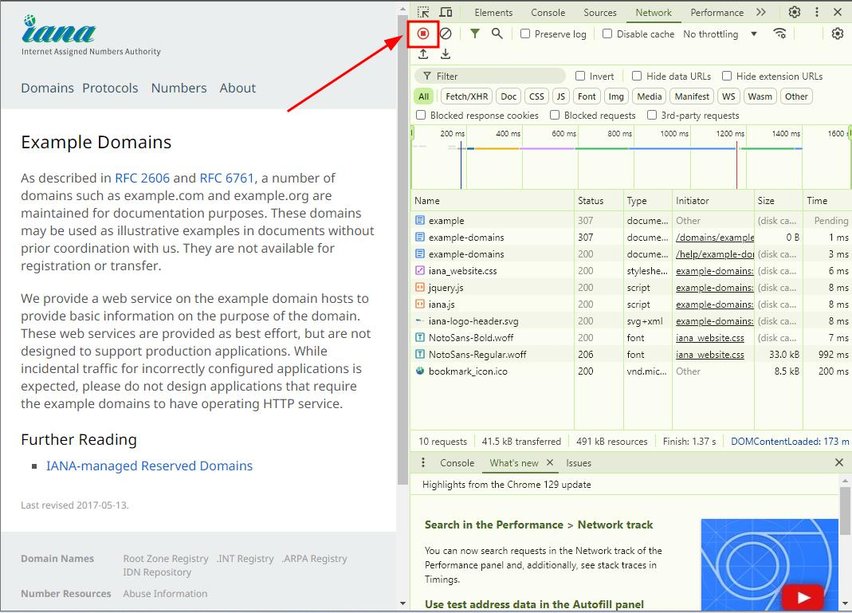
5. Stop the Network Recording
Click the record button again to stop recording. This stops the collection of data once all the necessary actions have been completed.
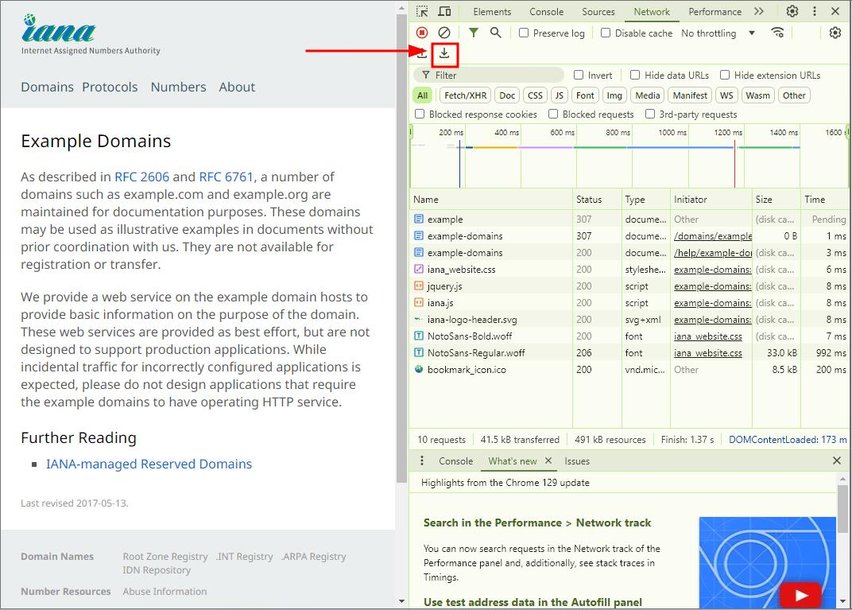
6. Export the Network Logs as a HAR File
Click the download icon in the Network tab to export the logs.
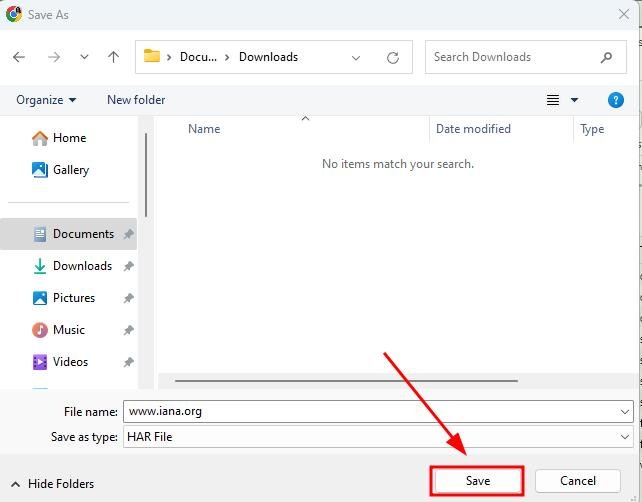
Save the logs as a .HAR file to a location on your computer by clicking “Save.”
7. Verify the Exported HAR File
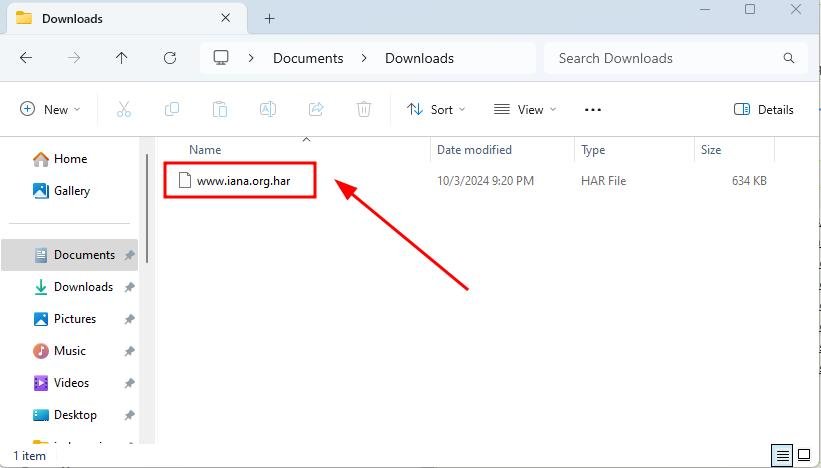
Locate and open the saved .HAR file on your computer. Confirm that it contains the expected network data before sharing or analyzing it.
We hope that you now have a better understanding of how to export your network logs in Chrome. If you enjoyed this article, you might want to check our articles on how to export a certificate from Chrome and how to export Safari passwords to Chrome.

